Theory Lab: When a Group Is Smarter Than Its Smartest Member
Four instances of a language model proposed and revised predictive theories of a hidden simulator of group decision-making. Over three exploratory runs, we tracked their accuracy, the benefit of revisions and the averaging of predictions. The combination of theories outperformed the machine learning models we used; its advantage over individual theories depended on how we select them. The experiment also showed how measurement noise and the form of feedback affect the results.

Why we built the Theory Lab
We built a small research lab in which four AI teams devise, test and revise scientific theories on their own. Over a single day, the experiment ran in three waves: 36 theories, 41 calls to the Claude Opus model and roughly six hours of compute for $63. The lab's combined answer predicted better than the machine learning models we used and, in all three waves, also better than the best accepted single theory. How large this advantage is, however, depends on how we select the single theory.
The inspiration came from an announcement by the startup Physical Superintelligence (PSI) in November 2026. According to its authors, its research system, running on an unreleased Anthropic model, proved a mathematical conjecture from 2008. The proof was checked by Lean, a program that verifies every logical step. At the time of the announcement this was a fresh preprint, and independent review was still under way.
What caught our attention was mainly the method. The AI didn't win anyone over with words. It proposed, and an independent, incorruptible judge decided what holds. The principle “hypothesis generator + independent judge + repeated improvement” is a general one.
So we asked ourselves: does the same loop work outside mathematics? That is, in places where there is no Lean, such as psychology or philosophy?
In this article you will find:
- what question we investigated and what science already knows about it,
- how the lab works, step by step and with examples,
- the three waves of the experiment, including the mistakes we made along the way,
- the independent critique we received and what we did with it,
- what we concluded and what it means for teams of people and of AI agents.
The article is long; it takes about half an hour to read. If you're in a hurry, you can skip straight to the chapter What we concluded.
Interactive report: the full text of all 36 theories, charts, statistics and every ratchet decision are in the interactive report (in Czech).
At a glance
What we measured: how accurately theories written by AI predict the outcomes of a hidden simulator of group decision-making. These were not experiments with people. The yardstick is the error of a probabilistic prediction: the Brier score in the first two waves, and in the third wave the MSE against the share of winning groups. Lower is better, and the third-wave numbers are not directly comparable with the first two.
| Wave | The lab's answer | Best accepted theory | Best baseline |
|---|---|---|---|
| 1 | 0.078 / 0.098 | 0.083 / 0.108 | 0.112 / 0.137 |
| 2 | 0.075 / 0.085 | 0.093 / 0.131 | 0.131 / 0.139 |
| 3 (different metric) | 0.032 / 0.037 | 0.041 / 0.070 | 0.086 / 0.175 |
Values are hidden test / large groups. In wave 1 there was no ratchet yet, so the lab's answer is the average of the first versions and the best theory is the best first version. One exception: in the second wave, the version with the lowest validation error of all, which the ratchet rejected, would have beaten the average on the test (0.070 versus 0.075), but not on large groups (0.106 versus 0.085).
The question: when is a group smarter than its best member
We investigated a single question: under what conditions is a group more intelligent than its most intelligent member? We're not asking whether a group is better than its average member. That tends to be easy. We're asking whether it can beat the best person in it.
Imagine a meeting of five doctors, one of whom is a top specialist. If the group simply averages its opinions, the weaker voices “dilute” the specialist. To beat the specialist, the group has to add something they don't have on their own: different information, a different angle, or a correction of their mistake.
Four everyday situations show when groups win and when they lose:
- The group wins: a hundred people guess the number of candies in a jar. The average guess is usually closer to the truth than almost any individual, because overshooting on one side cancels out undershooting on the other.
- The group wins: a car won't start, and the fault has three causes. An electrician finds a faulty cable, a mechanic a clogged filter and a programmer a bug in the control unit. None of them could fix the car alone; together they can.
- The group loses: a jury answers a trick question that most people intuitively get wrong. Voting doesn't cancel the error; it confirms it.
- The group loses: at a meeting, the loudest and most self-confident person decides, not the most capable one. The group is then only as smart as its status ranking matches real competence.
Today the question has a very practical side, for people and for artificial intelligence alike:
- Companies and teams have to decide when to call a meeting, when to let an expert decide and when to simply vote.
- AI developers now routinely combine several agents: one writes, another checks, a third votes. When does that produce something smarter than the best agent, and when is it just expensive noise?
- Science comes at this from three directions: philosophy asks what collective knowledge is, psychology studies how groups make decisions, and computer science builds systems out of many models.
In our experiment, “beating the best member” has a precise meaning. The best member is the one with the genuinely highest competence, and they solve the same tasks as the group, only alone. The group itself doesn't need to know who that is. It wins when it is better by at least one percentage point in success rate, or, for estimates, has at least 1% less error.
What we already know about collective intelligence
Science knows six mechanisms that decide whether a group beats its best member. We later built all of them into the simulated world, and the AI teams had to rediscover them without seeing the world from the inside.
1. Wisdom of crowds and correlated errors
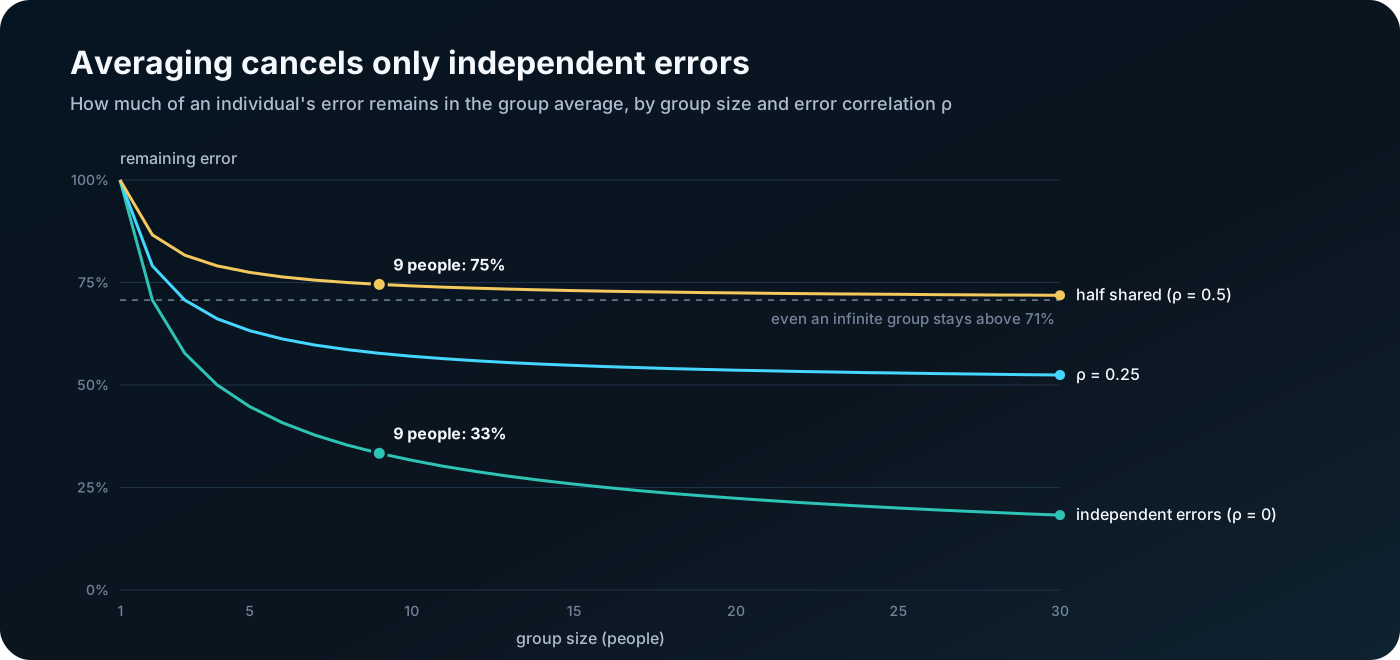
In 1906, at a livestock fair in Plymouth, England, almost 800 people guessed the weight of an ox. The median guess was off from the actual weight by less than 1%. Averaging works because independent errors cancel each other out.
The catch is in the word independent. If everyone has read the same misleading article, they err in the same direction and the average doesn't cancel the error. Mathematically: the error of the average shrinks to √(ρ + (1 − ρ) / n) of the original error, where n is the group size and ρ is the error correlation. This holds on the assumption that everyone's errors are equally large and every pair of members has the same correlation. For the mean absolute error, we additionally assume normally distributed errors.
- Nine people with independent errors (ρ = 0) cut the error to a third.
- Nine people whose errors are half shared (ρ = 0.5) cut it only to about 75%.
- And when one member is much more accurate than the others, the average actually “dilutes” that member's accuracy.
2. Condorcet's theorem and its reversal
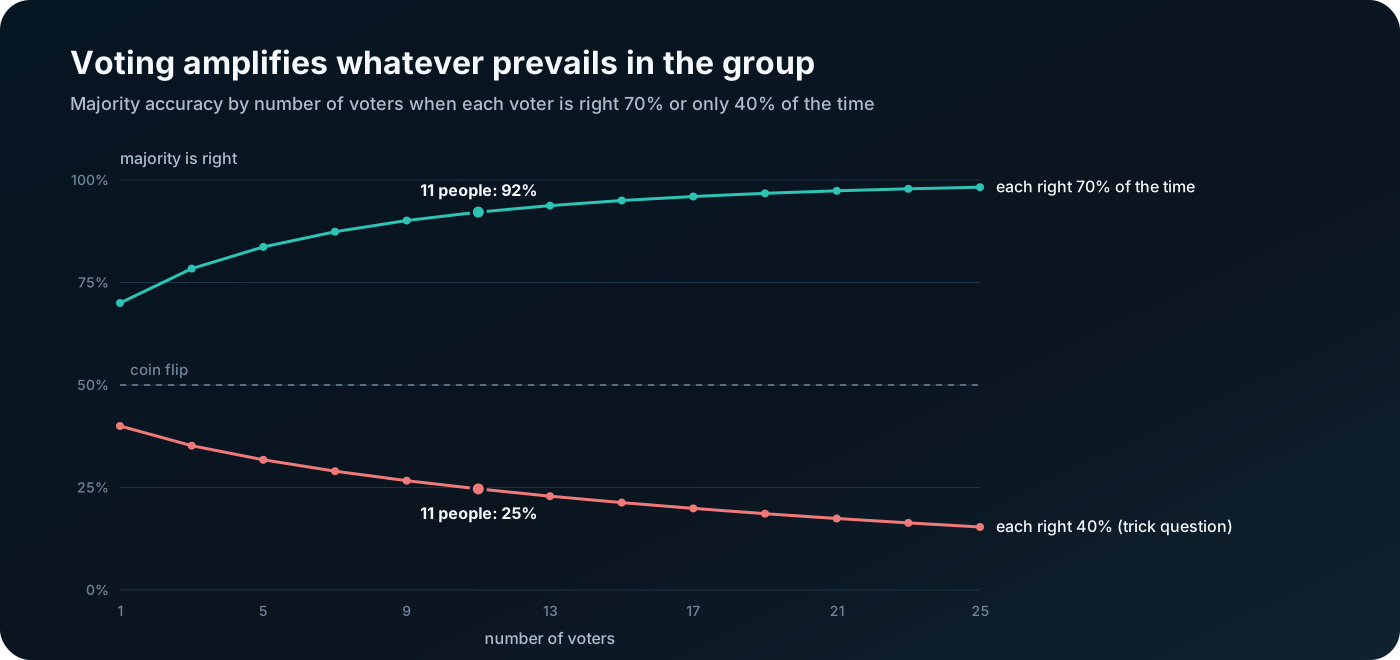
In 1785, the Marquis de Condorcet showed that a majority can be smarter than individuals. If all jurors have the same chance of getting the answer right, greater than 50%, and decide independently, the majority is right more often than any one of them. Eleven jurors, each right 70% of the time, reach the correct majority decision in roughly 92% of cases. The assumption of equal accuracy matters. Three independent voters who are right 99%, 51% and 51% of the time reach the correct majority only about 75% of the time, so they make their best member considerably worse. That, too, is an answer to our question.
But the theorem also works in reverse. Take a trick question: A bat and a ball cost $1.10 in total. The bat costs $1.00 more than the ball. How much does the ball cost? Most people intuitively answer 10 cents; the correct answer is 5 cents. When each person is right only 40% of the time, a majority of eleven people gets it right only about 25% of the time. Voting doesn't cancel the error; it amplifies it.
3. Demonstrability: truth wins
Psychologist Patrick Laughlin classified tasks by whether the correct answer can be demonstrated. For a math problem or a riddle, it's enough for one person to find the solution. As soon as they say it out loud, the others immediately recognize it as correct, and “truth wins”.
With other tasks, this doesn't work. Which logo is better, which candidate will make a good colleague, which wine is the best? There, the correct answer doesn't convince anyone on its own, and the majority or status decides.
4. Hidden profiles: knowledge nobody voices
In 1985, Garold Stasser and William Titus found that in discussions, groups mostly focus on information that everyone already knows. Unique information held by just one person often never comes up at all.
An example: a hiring committee is choosing between candidates A and B. Each member knows a different weakness of candidate A, so each of them, taken separately, still sees A as the best. If they pooled their knowledge, B would clearly win. But the discussion revolves around candidate A's shared strengths. Complementary knowledge is thus both the strongest source of a group's advantage and the most fragile.
5. Status and visibility of competence
Groups listen to those who come across as competent: confident, senior, loud. When this impression matches real competence, a leader or a weighted discussion works brilliantly. When it doesn't, the group follows a confident person who is wrong. Example: the most experienced engineer on the team is quiet, and a new, self-assured manager makes the decisions.
6. Process losses and group size
In 1972, Ivan Steiner summed up group performance as potential minus process losses. Losses come from coordination, limited time, conformity or someone “free-riding”. A larger group has greater potential, but also greater losses. In an hour-long meeting of thirty people, the decision is actually shaped by only a handful of the most active.
None of these mechanisms answers the question on its own. The outcome depends on how they interact, and that is exactly a job for a theory: to combine them in a way that also predicts situations no one has seen before.
The core idea: AI proposes, an independent judge decides
Our core idea is simple: a model must not judge itself. Artificial intelligence proposes the theories, but whether they hold is decided by an independent judge that can't be swayed by eloquence.
Why isn't it enough for several chatbots to agree? Language models are persuasive, and a debate among several of them drifts toward what sounds best, not toward what is true. Voting among models also runs into the Condorcet problem from the previous chapter. If all the models share the same blind spot, voting only confirms it. So the question we're studying also applies to our own method.
In mathematics, the judge is Lean. In psychology there is no Lean, and experiments with people are slow and expensive. So we built a simulated world: a program that simulates groups of people solving tasks and plays the role of nature in the experiment. The AI teams never see its code, just as a scientist doesn't see the laws of nature. They only know the description of the experiment and its results.
| PSI (mathematics) | Theory Lab (collective intelligence) | |
|---|---|---|
| Who proposes | an unreleased Anthropic model | four Claude Opus 5.5 teams, each with a different disciplinary lens |
| Who judges | Lean, proof checking | the simulated world and a sandbox that runs the theory's code |
| What gets verified | every logical step of the proof | the theory's predictions for situations the team has never seen |
| When a change is accepted | only when the step is valid | from the second wave on, only when the revision improves the hidden score |
It's only fair to say what this tests and what it doesn't. The simulator contains mechanisms we built into it based on textbooks. So we're not testing whether the theories hold for real people. We're testing whether AI can discover the hidden rules of a system it can't see into, express them as a theory and generalize them to situations it has never seen.
That is precisely one of a scientist's key skills. And the test is clean, because we know the correct answer and can measure exactly what the AI found and what it missed.
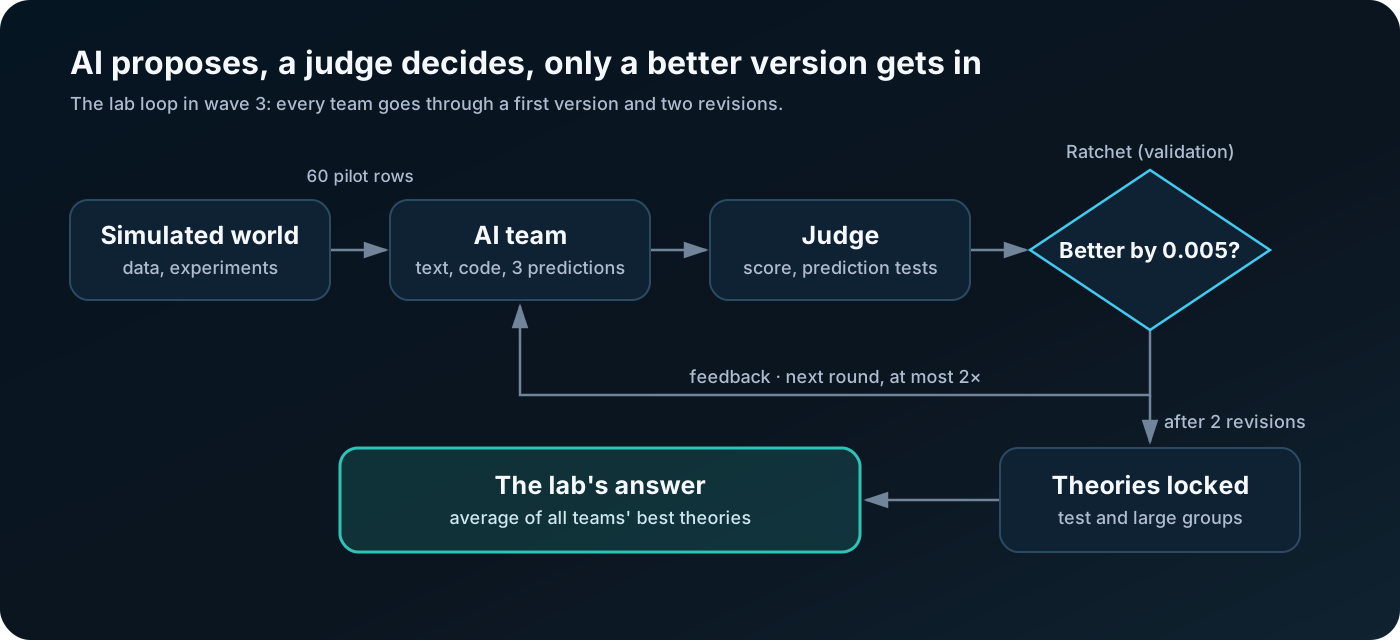
Each team goes through the loop three times: a first version and two revisions. From the second wave on, the ratchet decides whether a revision is accepted; in the third wave, the judge also tests predictions on new experiments.
The simulated world: where groups solve tasks
The simulated world is a program in which groups of virtual people solve thousands of tasks while we measure whether each group beat its best member. Each trial, which we call a condition, is a combination of a task type, a decision process and six numerical parameters.
Three task types
| Task | What members do | Real-life example | How it's scored |
|---|---|---|---|
| Estimate | each estimates an unknown number | the weight of an ox, project costs, number of customers next year | size of the error |
| Choice | a question with two options, one of which is correct | “Is the capital of Australia Sydney or Canberra?” | success rate |
| Puzzle | solving it takes several different pieces of knowledge | a car fault with three causes, diagnosing a rare disease | solved or not |
An individual solves a puzzle only if they know all the necessary pieces. A group can solve it even when each member knows only part of it, provided the pieces of knowledge actually come together in the discussion.
Three ways of deciding
- Independently: members don't talk to each other and their answers are combined mechanically. For estimates by averaging, for choices by voting, and for puzzles the group submits the solution of the most respected member among those who believe they've solved it. Like an online poll.
- Discussion: a free debate with limited time that ends in consensus. Like a meeting.
- Leader: the most respected member consults a few others and decides alone. Like a boss who hears out the team.
Six numerical parameters
| Parameter | Range | What it means | Example |
|---|---|---|---|
| Group size | 3–12, 16–60 in the final test | number of members | a team, a department, a whole company |
| Average competence | 0–1 | how capable the members are on average | students or professionals |
| Inequality of competence | 0–1 | how much the best member stands out | a well-matched team, or one star and some helpers |
| Error correlation | 0–1 | how similarly the members are wrong | everyone went to the same school and reads the same news |
| Visibility of competence | 0–1 | how well the group can tell who is capable | a team where everyone knows who the expert is, or one where confidence decides |
| Demonstrability | 0–1 | how easily others recognize the correct answer | a mathematical proof, or judging a wine |
What gets measured
In each condition, the group solves 2,000 tasks. Its best member solves the same tasks alone. We calculate how much better or worse the group did, and whether it won by at least one percentage point.
In the third wave, each condition is solved by ten different groups with the same parameters. We then measure the share of groups that beat their best member. We'll explain why this was necessary in the section on the second wave.
What's inside, hidden from the teams
The simulator has specific built-in rules that the AI teams were supposed to discover. For example:
- The success rate on a choice is 0.3 + 0.65 × competence. So the weakest members are wrong more often than if they flipped a coin, and they fall for the “bait”.
- A puzzle requires 5 pieces of knowledge. The group accepts a voiced piece of knowledge with probability 0.5 + 0.5 × demonstrability.
- In a discussion, only the 6 most respected members actually speak, and the leader consults at most five people. When estimating, the leader gives their own opinion a 70% weight.
- Those who didn't solve the puzzle wrongly believe otherwise with probability 0.5 × (1 − demonstrability). Such “false solvers” can override the real one.
We first checked the simulator with ten control tests, for example that it reproduces Condorcet's theorem, the wisdom of crowds and the harm done by correlated errors. Only then did we let the teams loose on it.
Teams of AI scientists, theories as code, and the judge
Four instances of the Claude Opus 5.5 model worked as separate research teams, each with a different disciplinary lens. We chose different lenses for the same reason diverse groups of people work: different perspectives make different mistakes.
| Team | Lens | The question it asks |
|---|---|---|
| Statistician | wisdom of crowds, Condorcet, correlated errors | How many errors cancel out through averaging? |
| Diversity | complementary knowledge, hidden profiles | What do the others know that the best one doesn't? |
| Social psychologist | Steiner, Laughlin, status, conformity | What gets lost along the way in the process? |
| Minimalist | Occam's razor | What is the smallest number of principles that will do? |
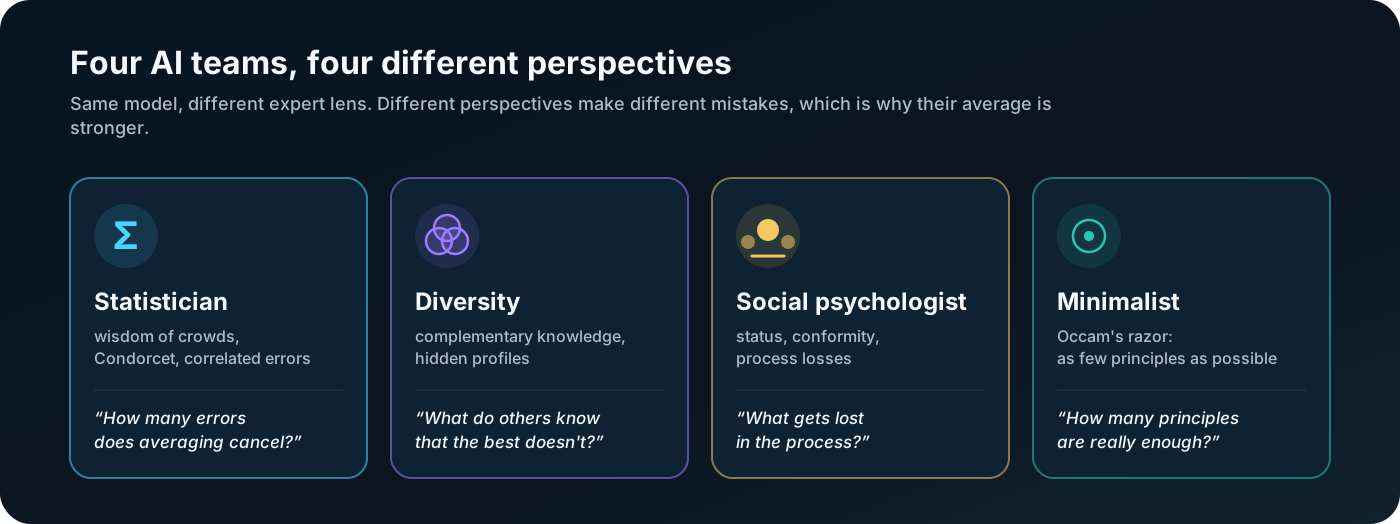
The teams run without tools and without file access, so they physically can't peek inside the simulator. At the start, they get only the description of the experiment, their lens and 60 pilot rows of data. Each row is one condition with its parameters and outcome.
What a theory looks like
Each theory has four parts:
- A name, for example “Assembling the Pieces Against Shared Blindness”.
- A claim: 4 to 8 sentences about which mechanisms are decisive.
- Three falsifiable predictions: bold claims that an experiment can refute.
- A
predict(c)function: a short Python program that, for any condition, returns the probability that the group beats its best member.
Why code? Words tend to be vague: “groups usually win when they're diverse” can't be measured. Code turns a theory into unambiguous predictions for every situation. The simulator then measures how well these predictions match its outcomes. Unlike a formal proof, however, the code's success doesn't prove that the verbal explanation holds too.
Here is an actual line from the Social psychologist's theory in the first wave:
k_del = min(n - 1.0, 6.0) # limited airtime: only ~6 other voices really heard
The comment says that with limited airtime, only about 6 other voices are actually heard. The experiment description mentioned only “limited time”. Whether the team derived the number 6 from the data or estimated it from what it knows about groups can't be told from its output. The simulator is set to exactly 6 speakers.
The judge and the Brier score
The judge runs the theory's code in an isolated process where only the math library is available, with no files and no network. For each condition, it compares the prediction with reality and computes the Brier score.
You know the Brier score from weather forecasts. A meteorologist says “80% chance of rain”:
- if it rains, their error is (1 − 0.8)² = 0.04,
- if it doesn't rain, their error is (0 − 0.8)² = 0.64,
- the Brier score is the average of these errors over all days.
Zero means a perfect forecast. Anyone who says “50%” every time gets 0.25, the coin-flip level. The lower the score, the better. In the third wave, we compared the prediction with the share of winning groups. The metric there is the mean squared error (MSE) against this share, and a constant 50% prediction scores about 0.22 on it.
The team then gets feedback from the training data: the overall score, a breakdown by the nine combinations of task and process, and the 30 biggest misses. Then it reworks the theory. Each team had two rounds of revisions, so each team produced three versions of its theory: r0, r1 and r2.
Workbook, quiz and exams
We split the data into four parts of 300 conditions each, much like at school:
| Set | School equivalent | What the team gets to see |
|---|---|---|
| Training | a workbook with the answers | everything: results and feedback |
| Validation | a quiz graded by the teacher | from the second wave on, only “accepted” or “rejected” |
| Test | a final exam on the same material | nothing |
| Large groups | an exam from a higher grade: groups of 16–60 members, versus only 3–12 in training | nothing |
The large-groups set is the toughest test. A theory that merely fitted the numbers to the training data fails there. A theory that has captured the real mechanism can carry it over into an unfamiliar range.
Comparison with machine learning
To find out whether the theories were any good at all, we compared them with machine learning models that have no theory behind them. We call them baselines: gradient boosting (an ensemble of decision trees), logistic regression and the training average. The baselines learn from all 300 training rows; the teams start with 60. If a theory couldn't beat simple curve fitting, it wouldn't be a good theory.
First wave: theories beat machine learning, but revisions hurt
In the first wave, theories that had seen only 60 rows of data predicted better than machine learning trained on 300 rows. But each subsequent revision tended to make them worse. The run took 148 minutes (181 minutes including a later supplementary run) and cost $18.21.
The setup was as simple as it gets. Each team wrote a first version and two revisions, and each revision automatically became the basis for the next one. Each condition was solved by a single group, and four model calls ran at once.
Results of the first versions
Brier score, lower is better:
| Model | Test (3–12 members) | Large groups (16–60) |
|---|---|---|
| Average of the four first theories | 0.078 | 0.098 |
| Diversity r0 | 0.083 | 0.108 |
| Minimalist r0 | 0.085 | 0.129 |
| Statistician r0 | 0.091 | 0.114 |
| Gradient boosting, 300 rows | 0.112 | 0.137 |
| Social psychologist r0 | 0.119 | 0.131 |
| Logistic regression | 0.122 | 0.285 |
Three of the four teams beat gradient boosting on the test, and Diversity and the Minimalist did so with statistical significance. Logistic regression collapsed outside the training range: on large groups it did worse than the plain training average (0.247). A straight line fitted to groups of 3 to 12 members makes no sense for a group of 50.
What the teams discovered
What surprised us most was how close the teams came to the simulator's hidden rules. From 60 rows, the Statistician estimated almost the same shape of the competence distribution within a group:
s = [min(0.99, max(0.0, m + 0.3 * sp * _ppf((i + 0.625) / (n + 0.25)))) for i in range(n)]
tau = 0.5 + 0.5 * dem  # chance a voiced piece is accepted
The simulator uses mean + 0.3 × inequality × a quantile of the normal distribution. The constant 0.3 matches exactly, but the team computed the quantiles slightly differently and capped the upper bound differently. The acceptance of voiced knowledge, 0.5 + 0.5 × demonstrability, matches the simulator exactly.
An overview of selected rules and how close the teams came to them:
| Simulator rule | Team's estimate | Match |
|---|---|---|
| competence: mean + 0.3 × inequality × quantile | Statistician: 0.3 × inequality × quantile, different quantile calculation and capping | approximate |
| acceptance of voiced knowledge: 0.5 + 0.5 × demonstrability | Statistician and Minimalist: the same relationship | exact |
| success ceiling of 0.95 | Statistician and Social psychologist: 0.95 | exact |
| the 6 most respected members speak in a discussion | Social psychologist: “about 6 voices” | exact |
| success rate on a choice: 0.3 + 0.65 × competence | Minimalist: a base of 0.3 + 0.7 × competence | approximate |
| the leader gives their own estimate a 70% weight | three teams: 65–67% | approximate |
| in estimates, discussion weights the estimates by status and by accuracy on the given problem | Diversity: the group picks “the best estimate for the problem, not the best person” | similar idea, different mechanism |
| a puzzle requires 5 pieces of knowledge | estimates of 2 to 4 | different |
| the leader consults at most 5 people | from 3 people to 80% of the group | different |
Capacity limits, such as the number of knowledge pieces or advisers, are the hardest thing to detect from data on small groups.
The loop can refute
In its first revision, the Minimalist introduced a “competence ceiling”: when everyone is very capable, the best member has nowhere left to pull ahead. In the second revision, the Minimalist wrote: “The data refuted the ceiling: at an average competence of 0.81, averaging lost by 17%.” And it replaced the ceiling with the correct relationship: error decreases linearly with competence, so among skilled members, the best one is relatively even more accurate.
But revisions could also lose ground. Both the Statistician and the Social psychologist had correctly stated in their first revision that “false solvers” become rarer as demonstrability increases. In the second revision, both of them dropped this correct dependency.
Revisions hurt
The first revision worsened the test result for all four teams, significantly so for three of them:
| Team | Test r0 → r1 |
|---|---|
| Minimalist | 0.085 → 0.128 |
| Diversity | 0.083 → 0.116 |
| Social psychologist | 0.119 → 0.149 |
| Statistician | 0.091 → 0.102 |
Meanwhile, the theories kept growing: the Minimalist's went from 873 to 1,406 syntax tree nodes, an increase of 60%. The feedback “here are the 30 biggest misses” tempted the teams to patch individual cases instead of finding better mechanisms. On top of that, the lab accepted every revision, even the worse ones, because nothing like Lean stood in the way.
Where the theories failed
On large groups, the theories overestimated puzzles solved through discussion. They predicted 89–93% wins; the reality was 79%. They reasoned, logically enough, that more members bring more knowledge. But in the simulator, only the 6 most respected members speak, so most of a large group's knowledge is never voiced.
A group of theories is smarter than the best theory
When we averaged the predictions of the four first theories, we got a better result than the best single theory: 0.078 versus 0.083 on the test, and 0.098 versus 0.108 on large groups. The average of all 12 versions even reached 0.092 on large groups. The lab thus demonstrated, on its own theories, exactly the phenomenon it studies: different lenses make different mistakes, and the average cancels them out.
Technical problems
- Stuck calls: 4 of 13 calls never returned. On Windows, the timeout killed only the launcher script; the actual process kept running and the lab kept waiting for it.
- Sandbox bug: the judge rejected the Statistician's revision because the code used the standard
reversedfunction, which we had forgotten to allow. That was our mistake. After the fix, the very same response passed, and we didn't have to pay for it again. - Supplementary run: because of the stuck calls, two teams didn't finish their revisions. We completed them two hours later: 3 calls, 33 minutes, $5.83, this time without a single stuck call.
We took three lessons from the first wave. Revisions need a judge that won't let a worse version through. The lab's answer should be a group of theories, not a single theory. And four simultaneous model calls are too many.
Second wave: the ratchet and the average of theories
In the second wave, the average of the theories was, for the first time, statistically significantly better than the best accepted theory. However, the new “ratchet”, which was meant to stop worse revisions, decided more or less at random. The run on new data took 96 minutes and cost $24.67. Not one of the 13 calls got stuck.
What we changed
- Ratchet: we added validation, 300 conditions the teams don't see. A revision passes only if it improves the Brier score on them by at least 0.005. Otherwise, the team continues from its best version and learns only that the revision didn't pass. It's our counterpart to Lean, which accepts only a valid step.
- The lab's answer: it's no longer a single theory but the average of the predictions of the best accepted versions from all teams.
- Operations: at most two calls at once, each team runs its rounds separately, and the timeout kills the whole process tree.
Results
| Model | Test | Large groups |
|---|---|---|
| The lab's answer (average of the best theories) | 0.075 | 0.085 |
| Average of the first versions | 0.080 | 0.094 |
| Best single theory by validation (Statistician r1) | 0.093 | 0.131 |
| Gradient boosting | 0.131 | 0.139 |
The lab's answer beat gradient boosting by 0.056 on the test and by 0.054 on large groups. It beat the best accepted theory by 0.018 and 0.047. Both differences are statistically significant on both sets: the 95% bootstrap confidence intervals don't include zero.
One caveat: the version with the lowest validation error of all, the Statistician's r2, which the ratchet rejected, did better on the test than the average (0.070 versus 0.075). On large groups, however, it lost (0.106 versus 0.085). So the average demonstrably beat the best accepted theory, but not every single version. The likely reason is the same as with people: each team is wrong in different places, and the average cancels out the errors.
The ratchet couldn't tell subtle differences apart
The ratchet reliably stopped disasters. It rejected all three clearly worse revisions (Diversity r1 and r2, Minimalist r1). With subtler differences, however, it got things wrong:
- It accepted Statistician r1 because it improved on validation by 0.016. But on both the test and large groups, it was worse than the previous version (0.082 → 0.093 and 0.114 → 0.131).
- It rejected Statistician r2 because it improved on validation by only 0.001. Yet it was the best theory of the whole run on the test (0.070), and it was better on large groups too.
Of the eight decisions, three were correct, two were wrong and three were mixed. That's not much better than flipping a coin.
The likely cause: noise in the labels
We consider the measurement itself to be the likely cause. We took 60 conditions and simulated each one with 20 different groups. The parameters were identical; only the random assignment of status differed, meaning who is the leader and who gets to speak.
In 15 of the 60 conditions, some groups won and others lost. The share of wins ranged from 5 to 95%. On a larger sample of 300 conditions, such conditions made up 18 to 20%. So for roughly one in five conditions, the outcome for a single group is close to a coin toss.
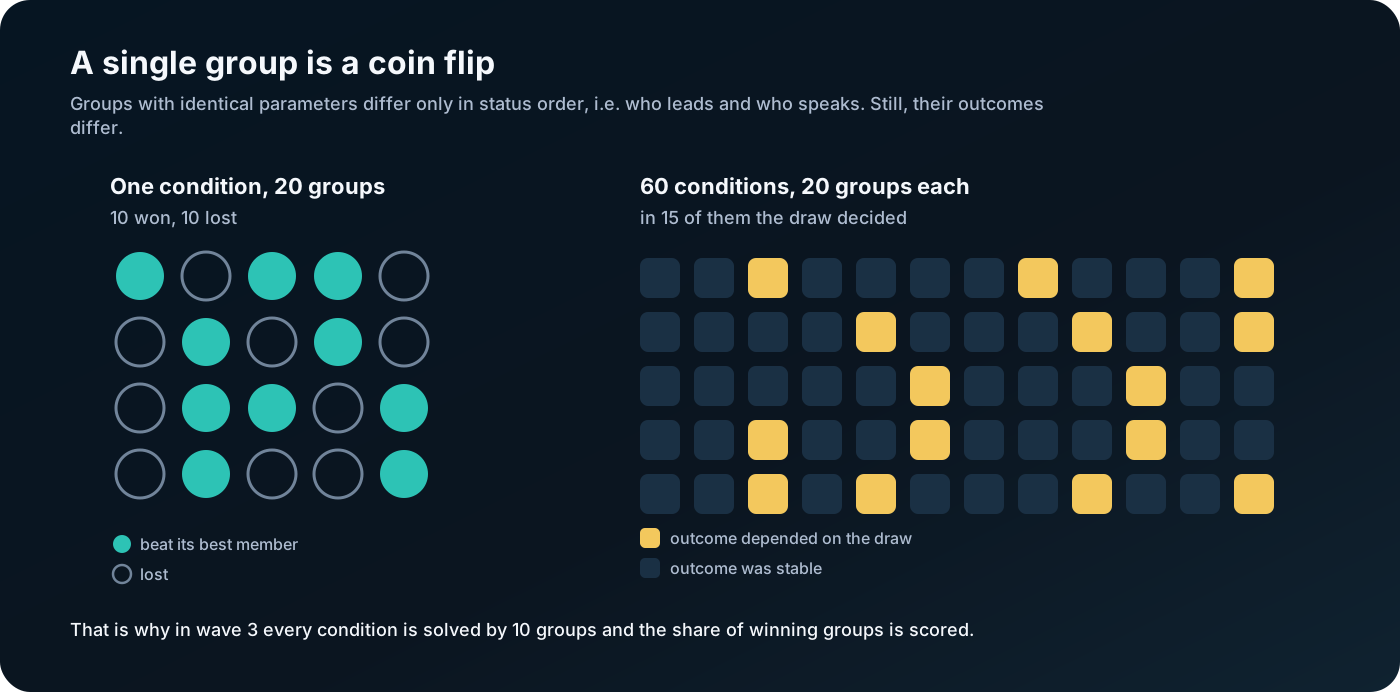
Imagine a teacher who grades each student on a single test question. Even an excellent student sometimes gets an F, and a weak one an A. This kind of noise created an irreducible Brier score error of 0.025 to 0.032. On its own, this doesn't prove that the ratchet decided at random: what it decides on is the difference between two theories on the same conditions, and that is less noisy. But the noise makes it considerably harder to distinguish subtle differences.
The lesson: a judge must be not only independent but also sufficiently precise. Lean doesn't make mistakes with a mathematical proof; our judge was working with noisy data.
One technical detail: one response arrived truncated because the model's API returned only the last block of text. The judge rejected it because of its format, and the second attempt passed.
Independent critique: six suggestions and what we did with them
After the second wave, we had the experiment reviewed, and we accepted the critique in full. The review was prepared by a different AI assistant: it went through the simulator, the team orchestration and the saved results, reran the tests and recomputed the theories. We checked every claim that could be checked ourselves. All of them held.
1. Hidden tests could leak
The judge also ran the theory's code on the hidden data. When the code crashed, the error text went back to the team. A theory that printed out the whole condition when it hit an error could thus give away the parameters of the hidden exams, for example that they include groups of 40 members.
This didn't happen in the first two waves, but the path existed. The fix: the hidden sets are scored only after all theories have been locked. From validation, the team learns only “accepted” or “rejected”, and errors on hidden data aren't reported anywhere.
2. One group is a noisy label
Solving 2,000 tasks doesn't mean 2,000 independent groups. Respect, the leader and the speakers are drawn once for the whole condition. The review found 14 of 60 conditions that gave the opposite result with a different draw. We measured 15 of 60.
This very point explained why the ratchet got things wrong in the second wave. The fix: each condition is solved by ten groups, and what's scored is the share of those that won. The average gain and its variance are saved as well.
3. Nobody checked the verbal claims
The judge scored only the predict(c) function. The verbal predictions could be false and nobody would notice. Example: in the second wave, Diversity claimed that “a puzzle with discussion never has a gain lower than −0.01”. Yet the training data contained four counterexamples, the worst one with a gain of −0.199.
The fix: every prediction is now machine-readable. It states which region of the parameters it applies to, what quantity it measures and what threshold it must meet. The judge simulates 40 new conditions in that region and either confirms or refutes the claim. Only then does the word “falsifiable” take on a practical meaning.
4. Old results were mixed with new rules
The updated first-wave report labeled all versions as “accepted”, even though the first wave had no ratchet. For example, the Statistician got worse on the validation computed after the fact, from 0.073 to 0.085, and yet it was listed in the table as accepted. The review also pointed out that repeatedly making decisions based on the same validation gradually “wears it out”. That's why a final test that is never used for decisions is needed.
The fix: we corrected the old report. Each run now saves the configuration, the exact model identifier, all prompts, a copy of the code and the actual ratchet decisions. The test and large groups are never used for decisions.
5. What in the lab actually helps?
The review suggested comparing four different lenses, four neutral agents and a single agent on the same budget. It also pointed out that the comparison with machine learning isn't fair. The agent gets a description of the mechanisms as well as the numerical gain, whereas the classifiers learn only the yes/no outcome.
The fix: we added stronger baselines, logistic regression with task × process interactions and gradient boosting trained on the gain. The comparison of perspectives against neutral agents is still to be done.
6. Let the teams propose discriminating experiments
The most interesting suggestion: after the first theories, pick the conditions where their predictions diverge the most, simulate them and feed the results back to the teams. That's how real science works: it looks for the experiment that decides between competing theories.
The third wave already contains the seed of this: predictions are, in effect, experiments that a team designs itself. The actual selection of discriminating conditions is still to be done.
In addition, the review recommended saving the state after each round so that an interrupted run doesn't go to waste. We implemented that too.
Third wave: a more precise judge and tested predictions
In the third wave, revisions genuinely improved things for the first time, and the lab's answer was considerably more accurate than both the individual theories and the baselines. The run on new data took 81 minutes and cost $20.55. All 12 calls went through on the first try.
What we changed
- Ten groups per condition: the noise in the scored target dropped roughly tenfold, from 0.025–0.032 to about 0.003.
- Locking the theories: the test and large groups are scored only once all teams have finished.
- Tested predictions: each theory has three predictions in JSON format, and the judge checks them on new experiments.
- Run log: configuration, prompts, a copy of the code, and resuming after an interruption.
- Stronger baselines, and assembling the full response from all blocks of text.
What a tested prediction looks like
An actual prediction from the Statistician's first revision:
{"claim": "A simple average of estimates beats the best member even with high competence and high inequality, as long as error correlation is very low and the group is large.",
 "where": {"task": ["estimate"], "process": ["independent"], "skill_mean": [0.75, 1.0],
           "skill_spread": [0.4, 0.9], "correlation": [0.0, 0.1], "n": [9, 12]},
 "stat": "p_beats", "op": ">=", "value": 0.6}
In plain English: for estimates combined by averaging, with very capable and unequal members, nearly independent errors and 9 to 12 members, at least 60% of groups will beat their best member. That's a bold claim, because intuition says that among experts, the average only “dilutes” the best one. The judge simulated 40 new conditions in that region, and 100% of the groups beat their best member. The prediction met its threshold in the tested conditions.
To keep the teams from using predictions to peek at the final exam, they were only allowed to test groups of 3 to 12 members.
Results
The metric is the mean squared error (MSE) against the share of winning groups; lower is better. The numbers aren't directly comparable with the Brier scores of the first two waves. If we scored the same predictions with the classic Brier score against the outcome of each individual group, the lab's answer would get 0.062 on the test and 0.070 on large groups. The ranking of the models wouldn't change.
| Model | Test | Large groups |
|---|---|---|
| The lab's answer | 0.032 | 0.037 |
| Best single theory by validation (Minimalist r1) | 0.041 | 0.070 |
| Average of the first versions | 0.064 | 0.057 |
| Logistic regression with interactions | 0.086 | 0.175 |
| Gradient boosting | 0.106 | 0.090 |
The lab's answer beat the best baseline by validation, logistic regression, by 0.054 on the test and by 0.138 on large groups. Gradient boosting did better on large groups (0.090), but even against it, the lab's lead is 0.053. The lab's answer beat the best accepted theory, which also had the lowest validation error of all versions, by 0.010 on the test, though only as a point estimate and not with statistical significance, and by 0.033 on large groups, where the difference is significant. Logistic regression, the best baseline on validation, once again collapsed outside the training range.
In this configuration, revisions helped
Brier score on the test for each version:
| Team | r0 | r1 | r2 | Final |
|---|---|---|---|---|
| Diversity | 0.144 | 0.041 | 0.041 | r2 |
| Minimalist | 0.072 | 0.041 | 0.079, rejected | r1 |
| Statistician | 0.086 | 0.052 | 0.131, rejected | r1 |
| Social psychologist | 0.075 | 0.076, rejected | 0.109, rejected | r0 |
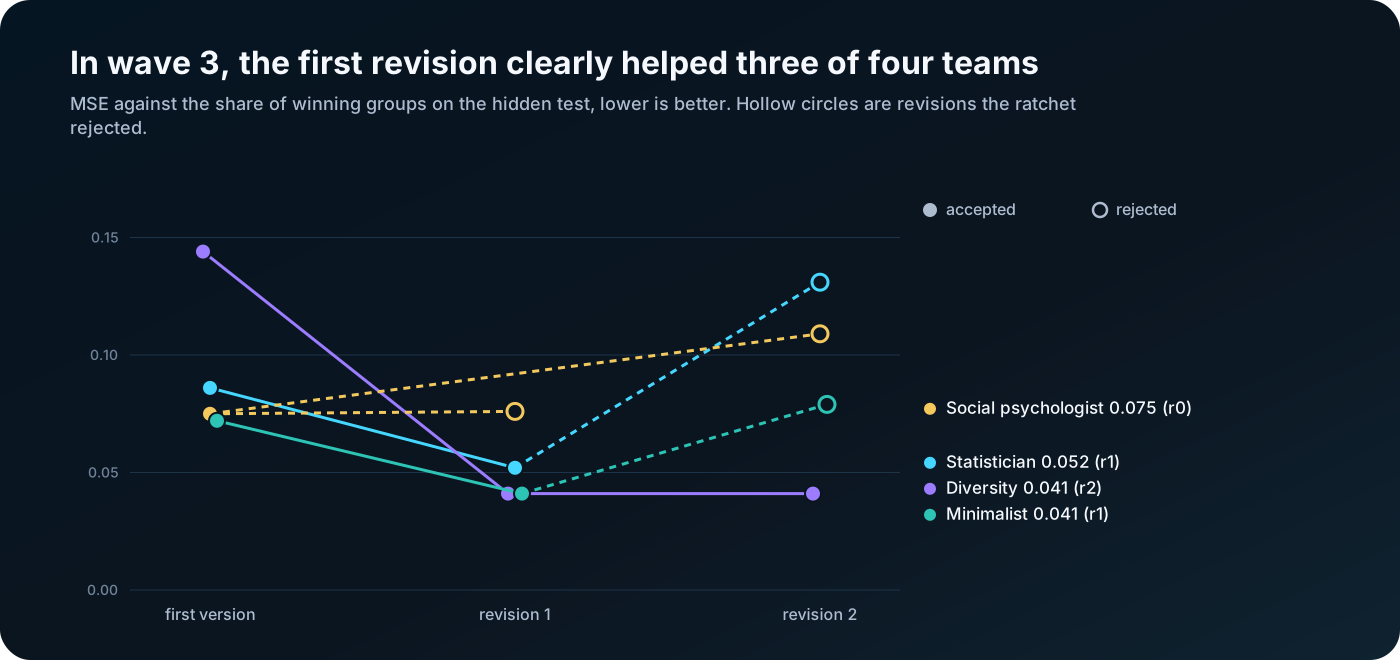
Three of the four teams improved markedly in their first revision. On large groups, the Statistician improved from 0.106 to 0.046, cutting its score by more than half. Diversity started out worse than the baselines and, after its revision, ranked among the best.
The second revision mostly didn't help: the ratchet rejected three out of four. The Statistician's r2 would have worsened its test score from 0.052 to 0.131. Without the ratchet, it would have made it into the lab's answer.
The ratchet decided correctly in 7 of 8 cases, compared with only 3 of 8 in the second wave. The only mixed decision was the rejection of the Minimalist's r2, which was worse on the test but slightly better on large groups. Thanks to the revisions, the lab's answer is significantly better than the average of the first versions: by 0.033 on the test and by 0.020 on large groups.
Predictions that passed, and those that didn't
Of the 36 predictions, 33 met their threshold in newly simulated conditions. Forty random conditions can support a claim or find a counterexample, but they don't prove it in general, and close results lack an uncertainty interval. Some examples:
- Met its threshold: “In a puzzle, discussion pools pieces of knowledge even at near-zero demonstrability. Groups with low correlation and weak to moderately capable members outperform their best member by at least 0.2.” (Minimalist r1). Observed gain: 0.33.
- Met its threshold, and predicts a loss: “In a choice task, the leader follows the majority of their advisers. With strong correlation, unequal skills and low demonstrability, the group loses to its best member by at least 2 percentage points.” (Minimalist r1). Observed: −8 points.
- Missed its threshold, narrowly: “Mechanical voting copies the typical member; with noticeable inequality, almost no group beats its best member (10% at most).” (Diversity r0). Observed: 16%.
- Missed its threshold, by a wide margin: the Statistician's r2 claimed that in puzzles with very capable and unequal members, at most 20% of groups win. Observed: 97%.
The predictions that missed their threshold belonged to versions that were also weaker by the numbers. Two belonged to revisions the ratchet rejected. The third belonged to Diversity's first version, which the team fixed in its next revision. A failed prediction thus probably also says something about the quality of the whole theory.
One caveat: a 92% success rate may also mean that the teams formulated cautious predictions. The lab can't yet measure how bold they are.
What we concluded
The most important result: in all three waves, the average of the theories was better than the best accepted single theory. The lab thus demonstrated, on its own work, the phenomenon it studies. How strong this result is, however, depends on which single theory we compare it with. Altogether, we arrived at seven conclusions, which apply to this experiment and these baselines.
1. The average of theories beat the best accepted theory
In all three waves, the average of all teams' predictions was better than the best accepted theory, with statistical significance in the second wave on both hidden sets and in the third wave on large groups. But if we simply picked the version with the lowest validation error of all, including the rejected ones, in the second wave that would have been the Statistician's r2, and it did better on the test than the average (0.070 versus 0.075). The advantage of the average thus depends on the selection method: against the best accepted theory it is clear, against the validation minimum only partial.
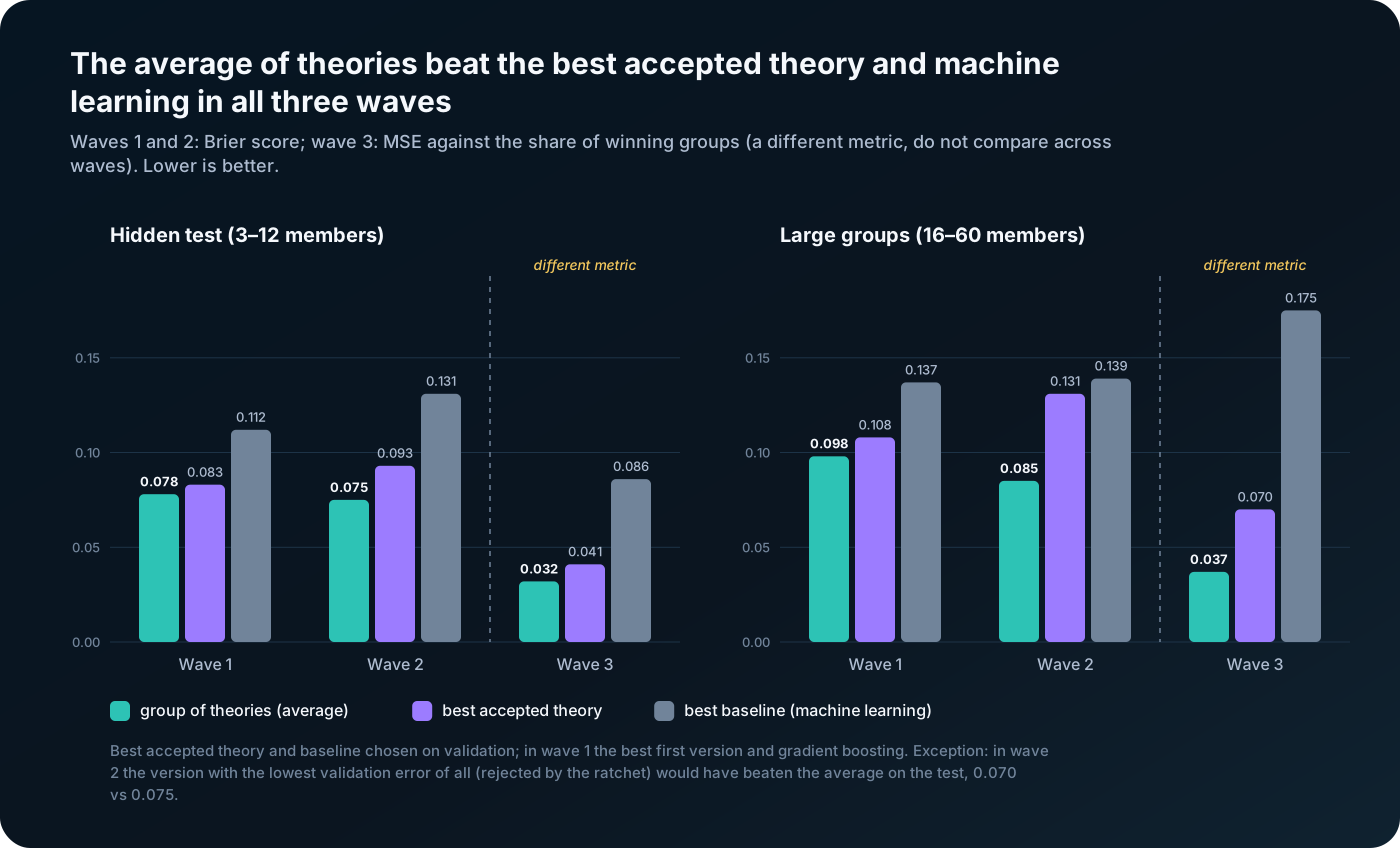
We know the likely reason from the chapter on the wisdom of crowds. The Statistician, Diversity, the Social psychologist and the Minimalist were wrong in different places, and the average canceled out their errors. If all the teams had been given the same brief, their errors would have been more correlated and the advantage would have shrunk. We want to test this hypothesis next time.
2. The theories extrapolated better than the baselines we used
The lab's answer beat the best baseline in all three waves. Its biggest lead was on the large groups that nobody had seen: in the third wave, 0.037 versus 0.175 for the best baseline by validation and 0.090 for gradient boosting.
A mechanism like “the error of the average shrinks to √(ρ + (1 − ρ) / n)” holds for a group of 50 people just as it does for a group of 5. A straight line fitted to groups of 3 to 12 members makes no sense outside its range. That's a good reason to look for mechanisms, not just fit curves to data. This applies, however, to our specific baselines, and in the third wave the teams also had targeted feedback from additional simulations, which the baselines didn't get.
3. Revisions helped only in the third configuration
In the first two waves, revisions hurt. In the third wave, they improved things, and the ratchet decided correctly in 7 of 8 cases. But we don't yet know why: the repetition of groups, the feedback from new experiments and the data all changed, and chance may have played a role too.
Our working hypothesis is that the bottleneck of the “propose, verify, fix” loop isn't the model but the quality of the feedback. Only controlled comparisons, which we describe in the chapter What's next, will test it.
4. The ratchet is needed even with a good judge
Even in the third wave, the second revision was mostly worse than the first. After receiving feedback, the model would rather rebuild the whole theory than carefully refine it. Without the ratchet, the good revisions would have been buried under the bad ones.
5. AI can discover hidden mechanisms; capacity limits are the hardest
The teams came close to most of the simulator's rules, for some of them including the constants: 0.3 × inequality, 0.5 + 0.5 × demonstrability, 6 speakers, a success ceiling of 0.95. Other estimates were only approximate or described a different mechanism, as the table in the chapter on the first wave shows. They were worst at estimating limits that only show up in large groups: the number of knowledge pieces and the number of the leader's advisers. These are almost impossible to detect from data on small groups.
6. Falsifiable predictions are worth it
The three predictions that missed their threshold belonged to weaker versions of theories. Predictions give the judge a second, independent channel: it evaluates not only the numbers but also whether the theory tells the truth about specific situations. And they force a theory to say something that might turn out to be false.
7. Infrastructure is half the research
Stuck calls, truncated responses, a sandbox bug and a possible data leak from the hidden tests: any one of these small things could have skewed the result. Without a record of the configuration and the ability to resume after an interruption, the results could be neither reproduced nor verified.
The simulated world's answer to our question
Across 4,500 conditions, we measured how individual factors affect a group's chance of beating its best member:
| Factor | Low value (0–0.25) | High value (0.75–1) |
|---|---|---|
| Error correlation | 81% | 36% |
| Inequality of competence | 80% | 47% |
| Demonstrability | 47% | 73% |
| Visibility of competence | 53% | 68% |
So a group beats its best member when:
- the members' errors and knowledge gaps are not correlated,
- competence is not too unequal,
- the correct answer can be recognized, or it's visible who is competent,
- the task requires combining different kinds of knowledge.
In puzzles, the group wins in 68–94% of conditions. In plain voting on a two-option question, it wins in only 10–21%. Average competence and group size have only a small effect overall, but a large one in specific situations: a larger group helps voting but actually hurts discussion.
A word of caution: we built these rules into the simulator ourselves, based on textbooks. This is the answer given by our model of the world, not a new discovery about people.
What this means for AI agents and human teams
The same rules that decide when a group of people beats its best member also decide when a group of AI agents beats the best agent. The following recommendations are our interpretation. They draw on the experiment and above all on the research literature; we haven't tested all of them directly in the lab.
For multi-agent AI systems
- Diversity, not clones. Give agents different lenses, roles or even different models. Clones are wrong in the same way, and then neither voting nor averaging helps. The average of our four lenses beat the best accepted theory.
- Independent proposals, then average. For numerical and probabilistic outputs, let agents work independently and average their answers. A shared debate can lead to herding, where the agents side with whoever is most persuasive. We didn't test agent debate in the lab; we're drawing on research on human groups.
- An external judge. Tests, simulations, formal verification or a measurable metric. Don't let models evaluate themselves.
- Precise evaluation first, more iterations second. A noisy evaluator turns iterations into a lottery. It pays to invest in the quality of verification before adding more rounds.
- A ratchet. Accept a change only if it improves the result on data the agent hasn't seen, and by a reasonable margin. Always keep the best version.
- Verifiable claims. Ask agents for concrete claims that can be checked automatically, and check them.
- Operations. Limit the number of concurrent calls, log the configuration and prompts, and design runs so they can be completed after an interruption.
For human teams
- When the correct answer can be demonstrated, for example with a calculation, code or a testable diagnosis, discuss. One person with the right solution is enough, as long as the others can verify it.
- For estimates and judgment calls, where the answer can't be demonstrated, collect opinions independently before the discussion. Otherwise everyone anchors on the first number or on the loudest person. This principle underlies, for example, planning poker in agile teams and the Delphi method.
- When you know who the expert is, let them decide after consulting the others. When you don't, the average of independent opinions is safer than a leader chosen for their self-confidence.
- Different backgrounds reduce correlated errors. A team of people from the same school who read the same news also shares the same blind spots.
- At a large meeting, most knowledge goes unspoken. Collect unique information in writing beforehand and ask everyone what only they know.
- Voting on trick questions amplifies the error. Where the majority might fall for a misleading intuition, don't decide by simple majority.
Limitations: what the experiment does not show
The experiment shows that AI can discover and refine theories of a hidden system. It shows nothing new about real people, and it has several weaknesses that are worth knowing about.
- The world is our model. We took the simulator's rules from textbooks. The teams could only discover what we had put into it.
- Each wave is a single run on different data. The differences between waves may partly come from the data and from the teams' luck. We need more repetitions.
- The third wave changed several things at once. A more precise target, tested predictions in the feedback and protection of the hidden data all arrived at the same time. We don't yet know which change caused the revisions to improve.
- The teams have a head start in knowledge. The model knows about Condorcet and Laughlin; the baselines don't. The comparison shows the value of prior knowledge and mechanisms, not a general superiority of language models over machine learning.
- Predictions may be cautious. A 92% success rate is good news only if the predictions take some risk. We don't measure that yet.
- Small samples. Each set has 300 conditions, so differences of around 0.01 in Brier score are often within the noise. That's why we report 95% bootstrap confidence intervals for the key comparisons.
- Choice of comparison. The advantage of the theory average depends on which single theory we compare it with. Against the best accepted theory it won in all waves; against the version with the lowest validation error, it lost on the test in the second wave.
- The third-wave metric is the MSE against the share of winning groups, not the classic Brier score. That's why we don't directly compare numbers across waves.
- One model. All the teams ran on Claude Opus 5.5. Other models, or a mix of models, may behave differently.
What's next
The next step is to find out what exactly caused the improvement in the third wave. After that, we want to let the lab loose on a world we didn't program ourselves.
- Ablation of the third wave. We'll run the same lab twice: once without tested predictions in the feedback, and once with a single group per condition. This will show whether the revisions improved thanks to the more precise judge or thanks to the predictions. Estimated cost: 2 × $20.
- Perspectives versus neutral agents. Four different lenses, four neutral agents and a single agent on the same budget. If we're right that the strength of the theory average comes from different errors, the neutral agents will have more correlated errors and their average will be weaker.
- Discriminating experiments. After the first theories, the lab will find the conditions where their predictions diverge the most, simulate them and feed the results back to the teams. Part of the budget will go to a random selection as a control.
- Bold predictions. We'll measure how much of the space a prediction rules out, and reward bold predictions that hold more than cautious ones.
- More repetitions. Several runs of each version on different data, so that luck can be separated from skill.
- Real groups. We'll replace the simulated members with groups of AI agents solving real tasks: estimates, logic puzzles, factual questions. The world will then no longer be our model, and the theories may discover something nobody put into it. Later on, groups of people could be involved too, with informed consent and ethical oversight.
- Philosophy. The same loop can be applied to philosophical arguments. Formal logic can verify whether a conclusion really follows from the premises. But no judge can verify whether the premises are true, and that is usually what philosophical disputes are about. Here, AI could at least systematically uncover the hidden assumptions that individual conclusions rest on.
The experiment in numbers
| Item | Value |
|---|---|
| Experiment waves | 3, plus a supplementary run of the first wave |
| AI teams | 4, Claude Opus 5.5 model (claude-opus-5-5) |
| Theory versions | 36: 4 teams × 3 versions × 3 waves |
| Model calls | 41, of which 4 got stuck, all in the first wave |
| Total run time | 358 minutes, roughly 6 hours |
| Cost at list prices | $63.43: $18.21 + $24.67 + $20.55 |
| Conditions per wave | 900 to 1,200 |
| Tasks per group | 2,000 |
| Groups per condition in the third wave | 10 |
| Tested predictions | 36, of which 33 met their threshold |
| Best result | MSE 0.032 on the test and 0.037 on large groups (third wave, the lab's answer) |
All the data, theories and charts are in the interactive report (in Czech).
Glossary
- Baseline: a machine learning model without a theory, used for comparison, for example gradient boosting.
- Brier score: the mean squared error of a predicted probability. 0 is a perfect forecast, 0.25 is a coin flip.
- Bootstrap and 95% confidence interval: repeated resampling of the data. When the interval for a difference doesn't include zero, the difference is statistically significant.
- Demonstrability: how easily others recognize that an answer, once voiced, is correct.
- Extrapolation: a prediction outside the range of the data the model learned from.
- Falsifiable prediction: a claim that an experiment can refute.
- Error correlation: how much the members of a group are wrong in the same way.
- Lean: a program for formally verifying mathematical proofs.
- MSE against the share of winning groups: the third-wave metric, the mean squared error of a prediction against the share of groups that beat their best member.
- p_beats: the share of groups that beat their best member.
- Sandbox: an isolated environment where a theory's code runs without access to files or the network.
- Validation: the data used to decide whether a revision is accepted. The team never sees it.
- Ratchet: a rule that accepts a change only if it demonstrably improves the result.
Sources
- Physical Superintelligence: research page on the proof of the Aaronson–Ambainis conjecture and Lean formalization on GitHub.
- Francis Galton: Vox Populi, Nature 75, 1907.
- Marquis de Condorcet: Essai sur l'application de l'analyse à la probabilité des décisions rendues à la pluralité des voix, 1785.
- Patrick R. Laughlin, Alan L. Ellis: Demonstrability and social combination processes on mathematical intellective tasks, Journal of Experimental Social Psychology 22, 1986.
- Garold Stasser, William Titus: Pooling of unshared information in group decision making, Journal of Personality and Social Psychology 48, 1985.
- Ivan D. Steiner: Group Process and Productivity, Academic Press, 1972.
- Shane Frederick: Cognitive Reflection and Decision Making, Journal of Economic Perspectives 19, 2005 (bat-and-ball problem).